2019年焦炭期货价格走势图怎么分析? Conrad 2019-06-11 16:30:20 2019年焦炭期货价格走势图怎么分析? Write Answer Share WeChat QQ QZone Weibo Facebook Twitter
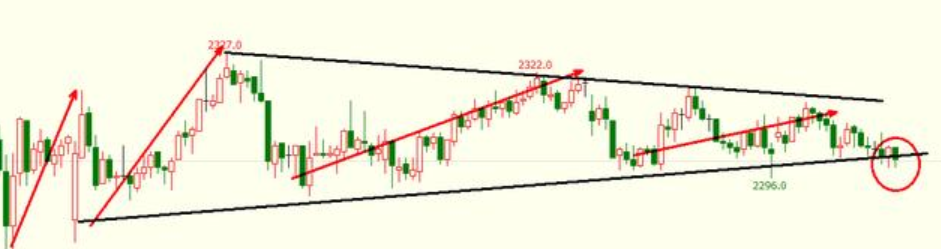
克里斯托弗 2019年焦炭期货价格走势图分析,借助经典理论也是可以做的,比如波浪理论,用下图作为例子,看5分钟走势,行情整体属于收敛三角,大概率会延续之前的空头趋势,同时红色箭头看到,整体多头上涨逐渐向右倾倒,也说明了多头有开始逐渐乏力的趋势。