


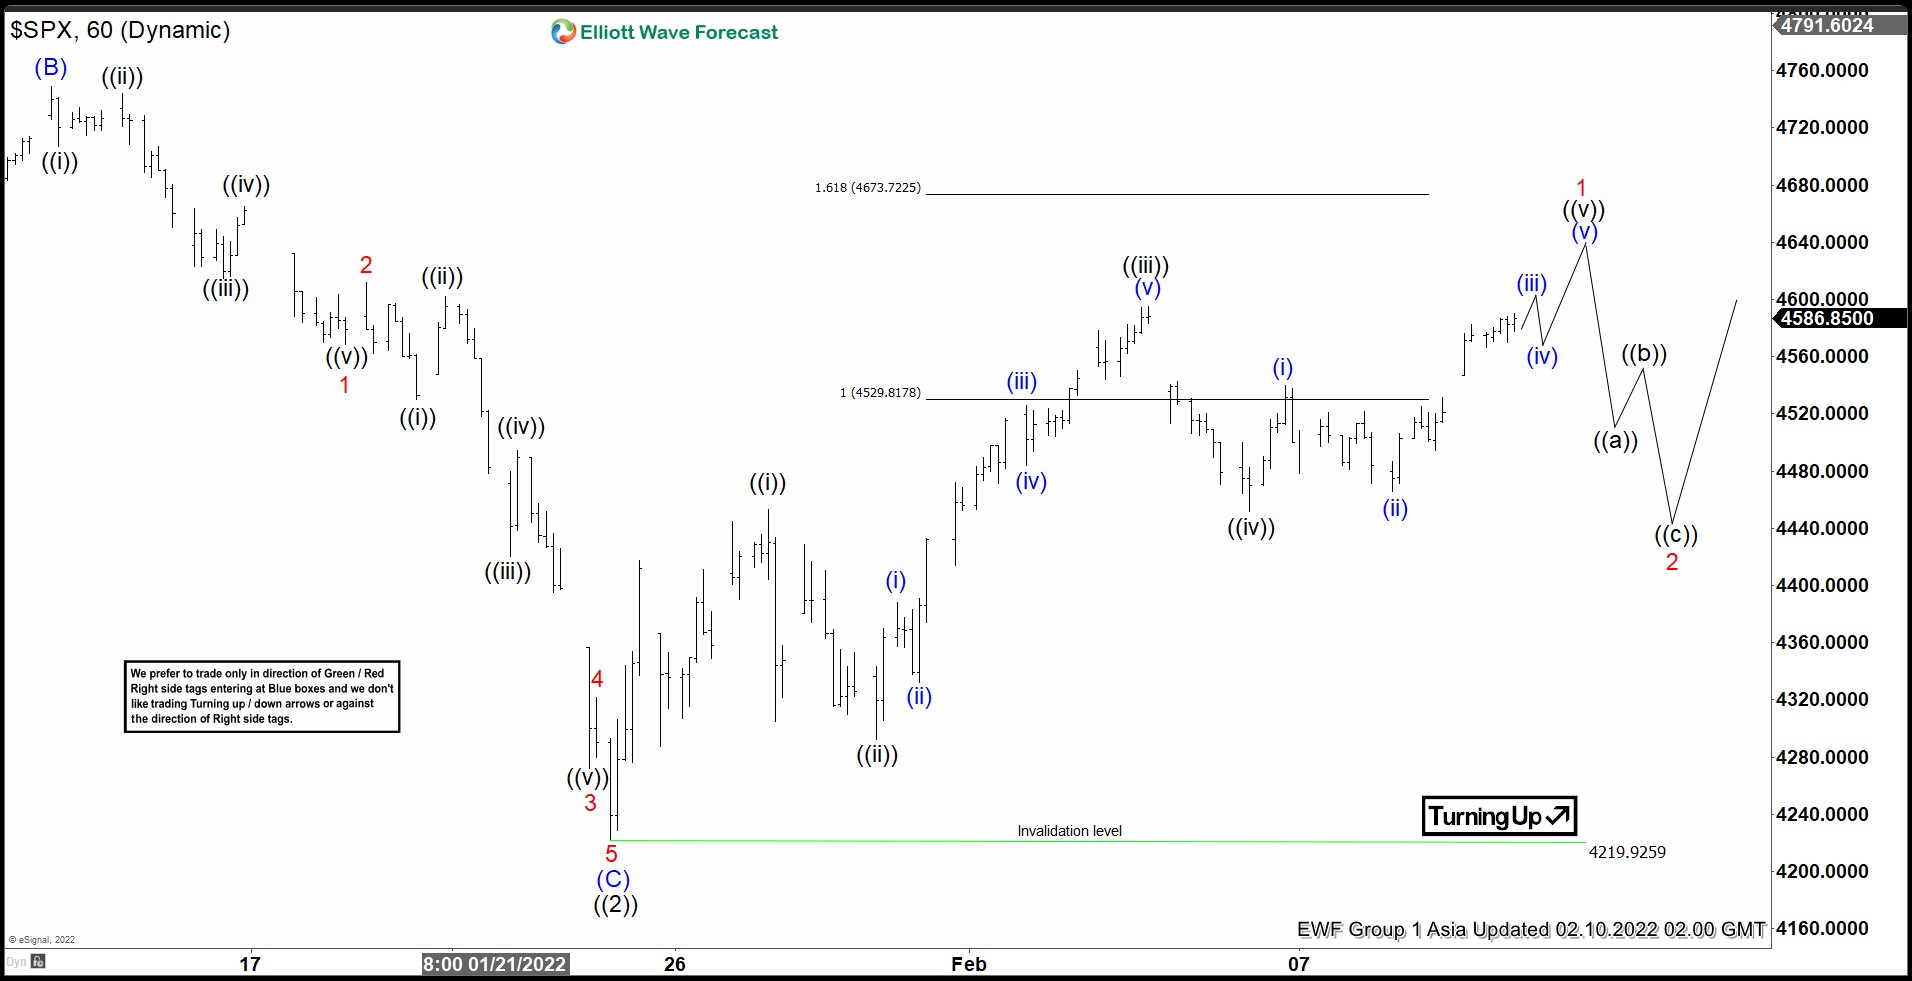
The short-term Elliott wave view in S&P500 (SPX) shows that we are looking for more upside to complete a 5 waves impulse structure, before see at least 3 swings pullback. The impulse move started from 4219 low to end wave ((i)) at 4453. A pullback in wave ((ii)) ended at 4292 low. SPX then resumes higher in wave ((iii)) with internal subdivision as another impulse in a lesser degree. Up from wave ((ii)), wave (i) ended at 4387, dips in wave (ii) ended at 4332, wave (iii) rallied to 4525 and a pullback appeared as wave (iv) ended at 4483. The last push higher to finish wave (v) ended at 4595. This completed wave ((iii)) in a higher degree.
Wave ((iv)) pullback ended at 4451. This level entered into the territory of wave ((i)) high which suggested a leading diagonal structure. Then the rally continued and we expect 5 waves up to finish wave ((v)) and wave 1. We could see already 3 waves up from wave ((iv)) low and we need 2 more waves complete the leading diagonal. The possible place to end this wave 1 comes in 4629 – 4684 area where we could find profit taking to begin a correction in 3, 7, or 11 swings. The view is valid as long as we stay above 4219.
S&P500 (SPX) 1 Hour Elliott Wave Chart
Penafian: Pandangan yang dinyatakan adalah semata-mata dari pengarang dan tidak mewakili kedudukan rasmi Followme. Followme tidak bertanggungjawab ke atas ketepatan, kesempurnaan, atau kebolehpercayaan maklumat yang diberikan dan tidak bertanggungjawab untuk sebarang tindakan yang diambil berdasarkan kandungan, melainkan dinyatakan secara bertulis secara jelas.
 Tiada ulasan lagi. Jadilah yang pertama berkongsi pandangan anda.