


| Scenario | |
|---|---|
| Timeframe | Weekly |
| Recommendation | SELL STOP |
| Entry Point | 43.50 |
| Take Profit | 40.00 |
| Stop Loss | 44.50 |
| Key Levels | 40.00, 41.00, 43.50, 44.00, 45.00, 46.20, 49.50 |
| Alternative scenario | |
|---|---|
| Recommendation | BUY STOP |
| Entry Point | 46.20 |
| Take Profit | 49.30 |
| Stop Loss | 45.50 |
| Key Levels | 40.00, 41.00, 43.50, 44.00, 45.00, 46.20, 49.50 |
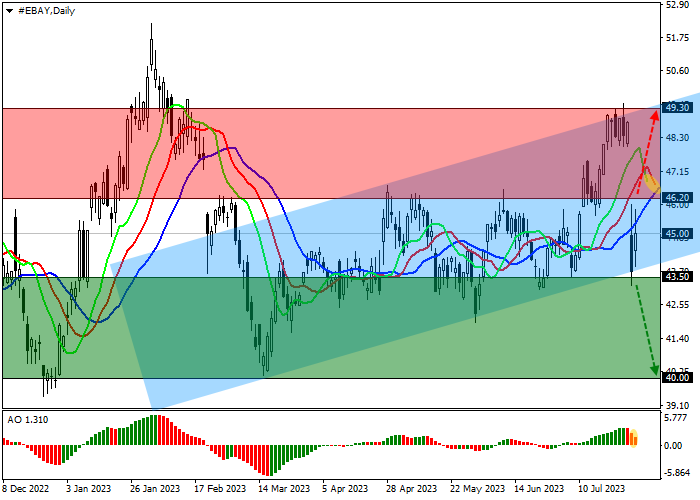
Shares of eBay Inc., an American online retailer, are correcting at 45.00.
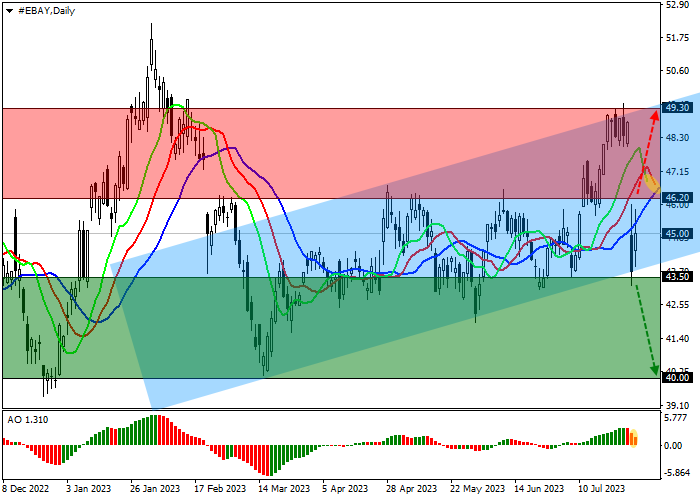
On the daily chart, the price is moving within an ascending corridor with dynamic boundaries 44.00–49.50, approaching the support line.
On the four-hour chart, if the decline continues, the channel’s support level, which coincides with last week’s local low of 43.50, is the key obstacle, after consolidation below which the quotes may leave the range, reach 41.00 and reach global targets around 40.00.
Technical indicators are slowing down, getting ready for a reversal: fast EMAs on the Alligator indicator are close to the signal line, and the AO histogram is forming downward bars in the buying zone.
Trading tips
Short positions may be opened after the price drops and consolidates below 43.50 with the target at 40.00. Stop loss – 44.50. Implementation period: 7 days or more.
Long positions may be opened after a reversal, growth, and consolidation of the price above 46.20 with the target at 49.30 and stop loss 45.50.
Penafian: Pandangan yang dinyatakan adalah semata-mata dari pengarang dan tidak mewakili kedudukan rasmi Followme. Followme tidak bertanggungjawab ke atas ketepatan, kesempurnaan, atau kebolehpercayaan maklumat yang diberikan dan tidak bertanggungjawab untuk sebarang tindakan yang diambil berdasarkan kandungan, melainkan dinyatakan secara bertulis secara jelas.
 Tiada ulasan lagi. Jadilah yang pertama berkongsi pandangan anda.