


| Scenario | |
|---|---|
| Timeframe | Weekly |
| Recommendation | BUY |
| Entry Point | 265.00 |
| Take Profit | 277.00 |
| Stop Loss | 260.00 |
| Key Levels | 205.00, 240.00, 255.00, 260.00, 265.00 |
| Alternative scenario | |
|---|---|
| Recommendation | SELL STOP |
| Entry Point | 255.00 |
| Take Profit | 240.00 |
| Stop Loss | 260.00 |
| Key Levels | 205.00, 240.00, 255.00, 260.00, 265.00 |
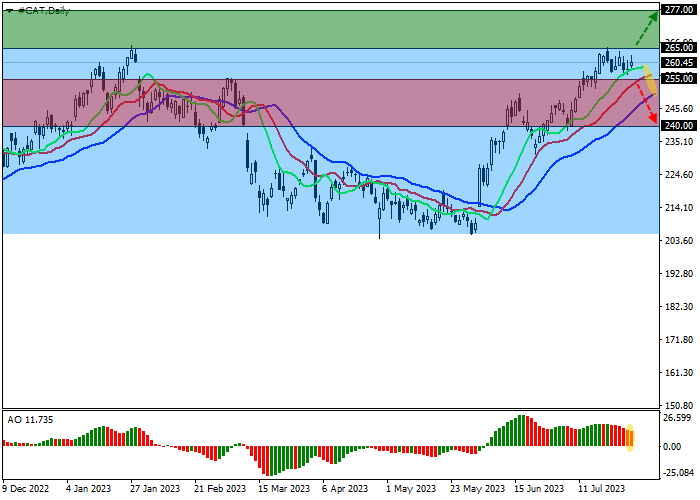
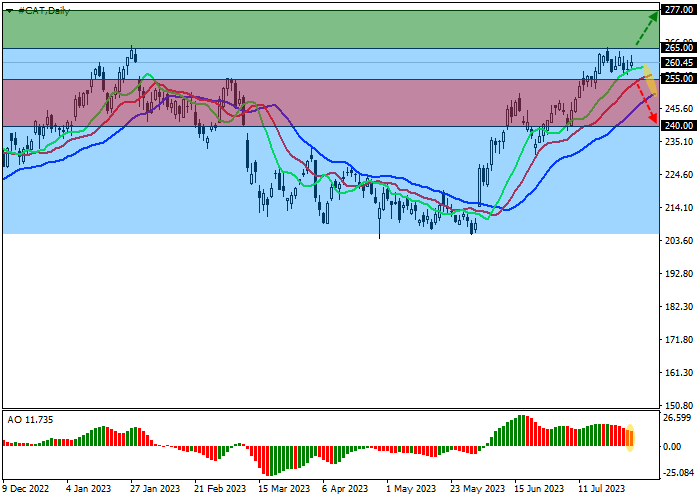
Shares of Caterpillar Inc., a global manufacturer of construction and mining equipment, are moving within a global corrective trend at 260.00.
On the daily chart, the price is holding within the sideways range of 205.00–265.00, trading near the range resistance line.
On the four-hour chart, the quotes reached the year’s high of 265.00, which coincides with the resistance line of the global channel, and after a correction to the 255.00 area, they may continue to grow.
Technical indicators keep a stable buy signal: fast EMAs on the Alligator indicator are far enough from the signal line, and the AO histogram forms corrective bars above the transition level.
Trading tips
Long positions may be opened after the price rises and consolidates above 265.00 with the target at 277.00. Stop loss – 260.00. Implementation period: 7 days or more.
Short positions may be opened after a reversal, reduction, and consolidation of the price below 255.00 with the target at 240.00. Stop loss – 260.00.
Penafian: Pandangan yang dinyatakan adalah semata-mata dari pengarang dan tidak mewakili kedudukan rasmi Followme. Followme tidak bertanggungjawab ke atas ketepatan, kesempurnaan, atau kebolehpercayaan maklumat yang diberikan dan tidak bertanggungjawab untuk sebarang tindakan yang diambil berdasarkan kandungan, melainkan dinyatakan secara bertulis secara jelas.
 Tiada ulasan lagi. Jadilah yang pertama berkongsi pandangan anda.