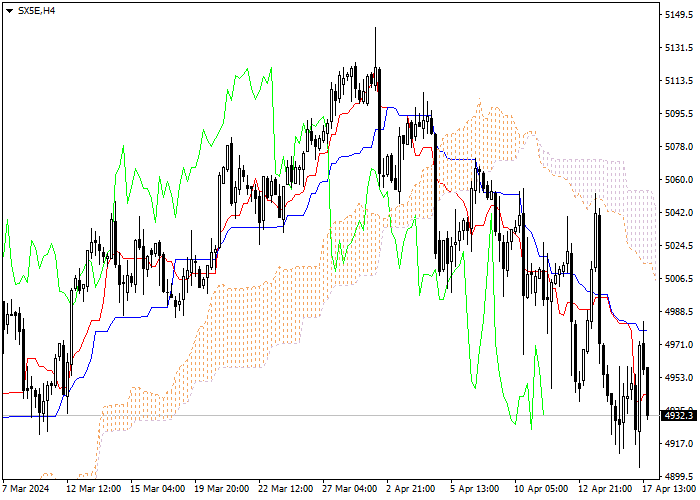
Let's look at the four-hour chart. Tenkan-sen line is below Kijun-sen, the lines are horizontal . Confirmative line Chikou Span is below the price chart, current cloud is descending. The instrument is trading below Tenkan-sen and Kijun-sen lines; the Bearish trend is still strong. The closest support level is Kijun-sen line (4967.7). One of the previous maximums of Chikou Span line is expected to be a resistance level (4814.0).
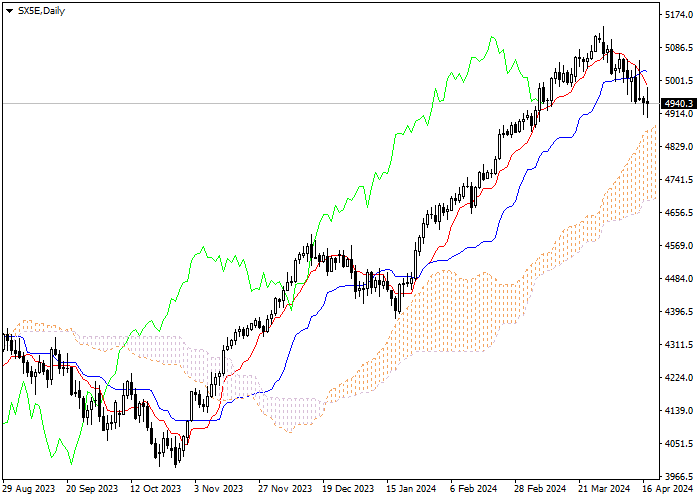
On the daily chart Tenkan-sen line is above Kijun-sen, the lines are horizontal . Confirmative line Chikou Span is below the price chart, current cloud is ascending. The instrument is trading below Tenkan-sen and Kijun-sen lines; the Bearish trend is still strong. The closest support level is Tenkan-sen line (4988.4). One of the previous maximums of Chikou Span line is expected to be a resistance level (4742.9).
On the both charts the instrument is still falling. It is recommended to open short positions at current price with Take Profit at the level of previous minimum of Chikou Span line (4814.0) and Stop Loss at the level of Kijun-sen line (4967.7).
Penafian: Pandangan yang dinyatakan adalah semata-mata dari pengarang dan tidak mewakili kedudukan rasmi Followme. Followme tidak bertanggungjawab ke atas ketepatan, kesempurnaan, atau kebolehpercayaan maklumat yang diberikan dan tidak bertanggungjawab untuk sebarang tindakan yang diambil berdasarkan kandungan, melainkan dinyatakan secara bertulis secara jelas.
Suka artikel ini? Tunjukkan penghargaan anda dengan menghantar tip kepada pengarang.
Balas 0
terhangat
Tiada ulasan lagi.Jadilah yang pertama berkongsi pandangan anda.



 Tiada ulasan lagi. Jadilah yang pertama berkongsi pandangan anda.