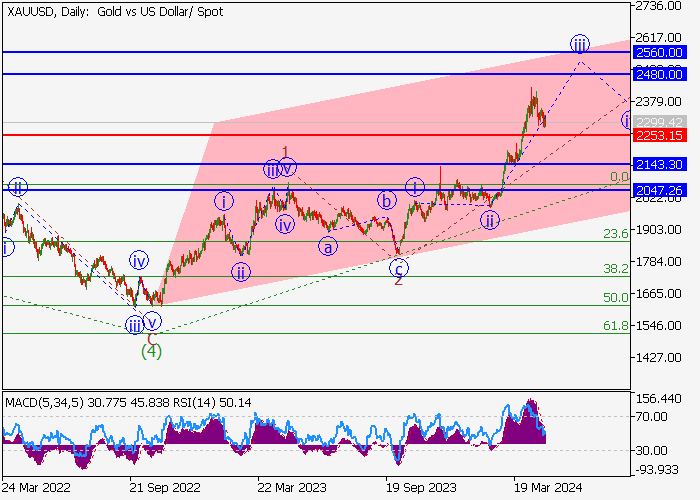
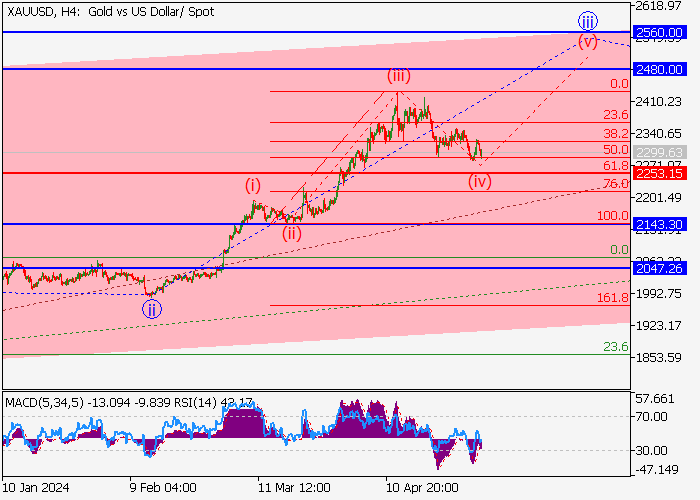
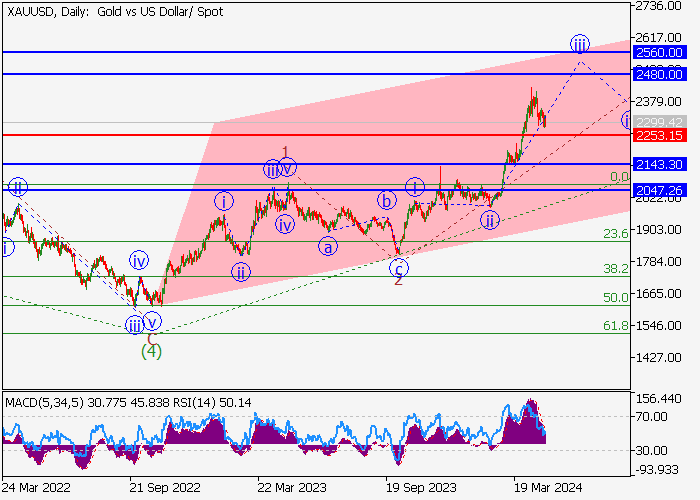
On the daily chart, the fifth wave of the higher level (5) of 3 develops, within which the wave 1 of (5) formed, a downward correction ended as the second wave 2 of (5), and the third wave 3 of (5) develops. Now, the third wave of the lower level iii of 3 is forming, within which the wave (iii) of iii has ended, and a local correction is ending as the wave (iv) of iii. If the assumption is correct, the XAU/USD pair will grow to the area of 2480.00–2560.00. In this scenario, critical stop loss level is 2253.15.
Main scenario
Long positions will become relevant above the level of 2253.15 with the targets at 2480.00–2560.00. Implementation period: 7 days and more.
Alternative scenario
A breakout and the consolidation of the price below the level of 2253.15 will let the asset go down to the area of 2143.30–2047.26.
Penafian: Pandangan yang dinyatakan adalah semata-mata dari pengarang dan tidak mewakili kedudukan rasmi Followme. Followme tidak bertanggungjawab ke atas ketepatan, kesempurnaan, atau kebolehpercayaan maklumat yang diberikan dan tidak bertanggungjawab untuk sebarang tindakan yang diambil berdasarkan kandungan, melainkan dinyatakan secara bertulis secara jelas.
Suka artikel ini? Tunjukkan penghargaan anda dengan menghantar tip kepada pengarang.
Balas 0
terhangat
Tiada ulasan lagi.Jadilah yang pertama berkongsi pandangan anda.



 Tiada ulasan lagi. Jadilah yang pertama berkongsi pandangan anda.