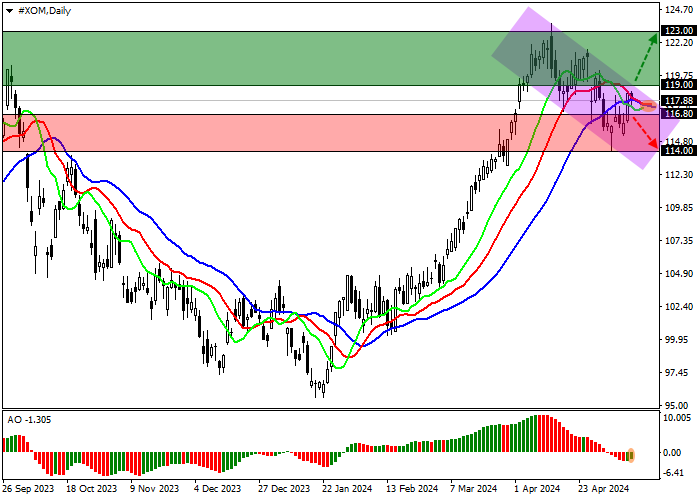
Shares of ExxonMobil Corp., an American oil company, are trading in a corrective trend at 118.00.
On the daily chart, the price is unsuccessfully trying to leave the downward channel of 119.00–113.00.
On the four-hour chart, the quotes are testing the resistance level of 119.00, and if it is broken, it may reach a yearly high of 123.00. A decrease is possible if the support level and the low of May 8, 115.00, are overcome in reverse, and then the target will be the support level of 114.00.
Technical indicators are in a state of uncertainty: fast EMA on the Alligator indicator are below the signal line, and the AO histogram forms ascending bars in the negative zone.
Trading tips
Long positions may be opened after the price rises and consolidates above 119.00, with the target at 123.00. Stop loss – 117.00. Implementation period: 7 days or more.
Short positions may be opened after the price declines and consolidates below 116.80, with the target below 114.00. Stop loss – 118.00.



 Tiada ulasan lagi. Jadilah yang pertama berkongsi pandangan anda.
