Shares of ExxonMobil Corp., an American oil company, are trading in a local corrective trend near 118.00.
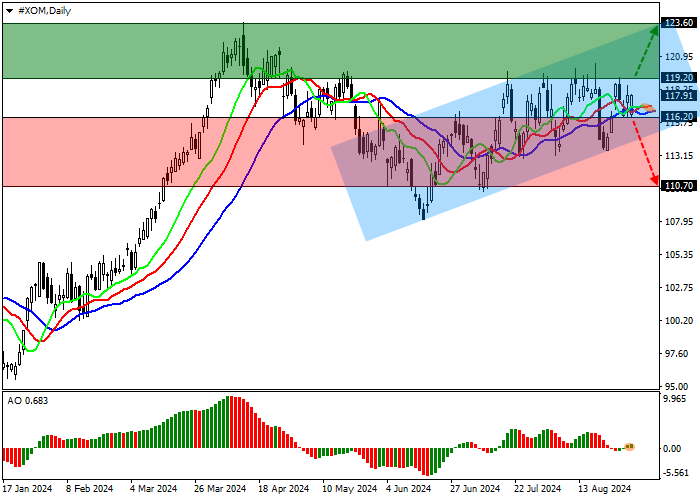
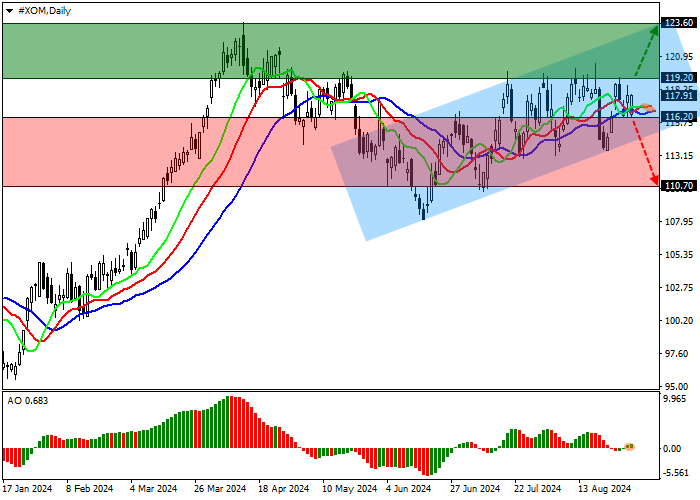
On the daily chart, the price is moving in an ascending channel between 124.00–116.00, approaching the resistance line.
On the four-hour chart, consolidation above the summer high will allow quotes to continue to rise to the yearly high of 124.00. However, for the scenario to be implemented, the price needs to stay above the support line at 115.00. In the event of a reversal, the channel will be the asset’s June low It can work as a Flag formation by allowing it to reach 110.00.
Technical indicators confirm the priority of long positions: the fast EMA on the Alligator indicator crossed the signal line upwards, and the AO histogram forms bullish bars above the crossing level.
Trading tips
Long positions can be opened after the price increases and consolidates above 119.20 with a target of 123.60. Stop loss around 117.00. Trading period: 7 days and above.
Short positions can be opened after the price declines and consolidates below 116.20 with a target of 110.70. Stop loss — 118.00.



 Tiada ulasan lagi. Jadilah yang pertama berkongsi pandangan anda.