


Hello fellow traders. In this technical block we’re going to take a quick look at the Elliott Wave charts of NIFTY Index published in members area of the website.
Recently, NIFTY formed a 3-wave pullback after a 5-wave rally, a textbook example of an Elliott Wave bullish sequence. Price completed a clear 3-wave move down from the peak and found support at the Equal Legs zone (buying area).
In the following analysis, we explain the Elliott Wave pattern and the market outlook.
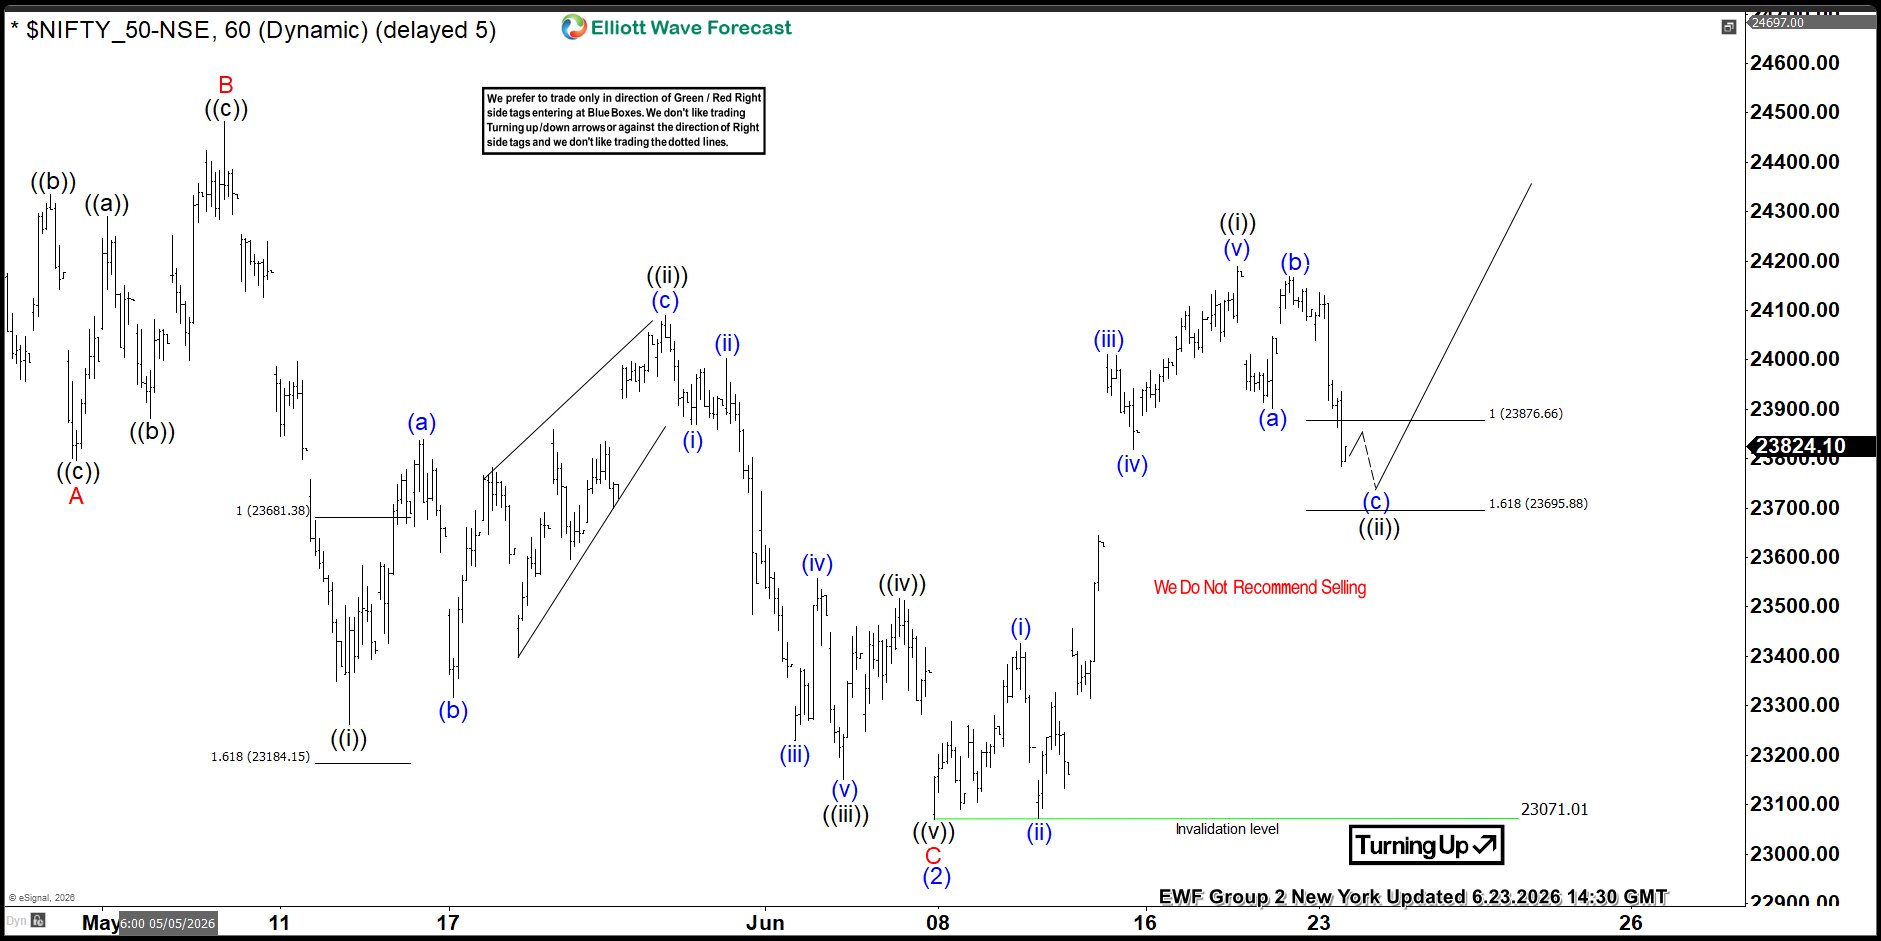
NIFTY Elliott Wave 1 Hour Chart 06.23.2026
NIFTY is forming an intraday 3-wave pullback from recent highs. We identified this pullback as an Elliott Wave Zig Zag pattern. As our members know , the buying zone is derived by measuring the Equal Legs area using the Fibonacci extension tool. The ideal support area comes in at 23876.66–23695.88. At that zone, we expect buyers to step in and take control, pushing price higher toward new highs.
You can learn more about Elliott Wave Patterns at our Free Elliott Wave Educational Web Page
90% of traders fail because they don’t understand market patterns. Are you in the top 10%? Test yourself with this advanced Elliott Wave Test
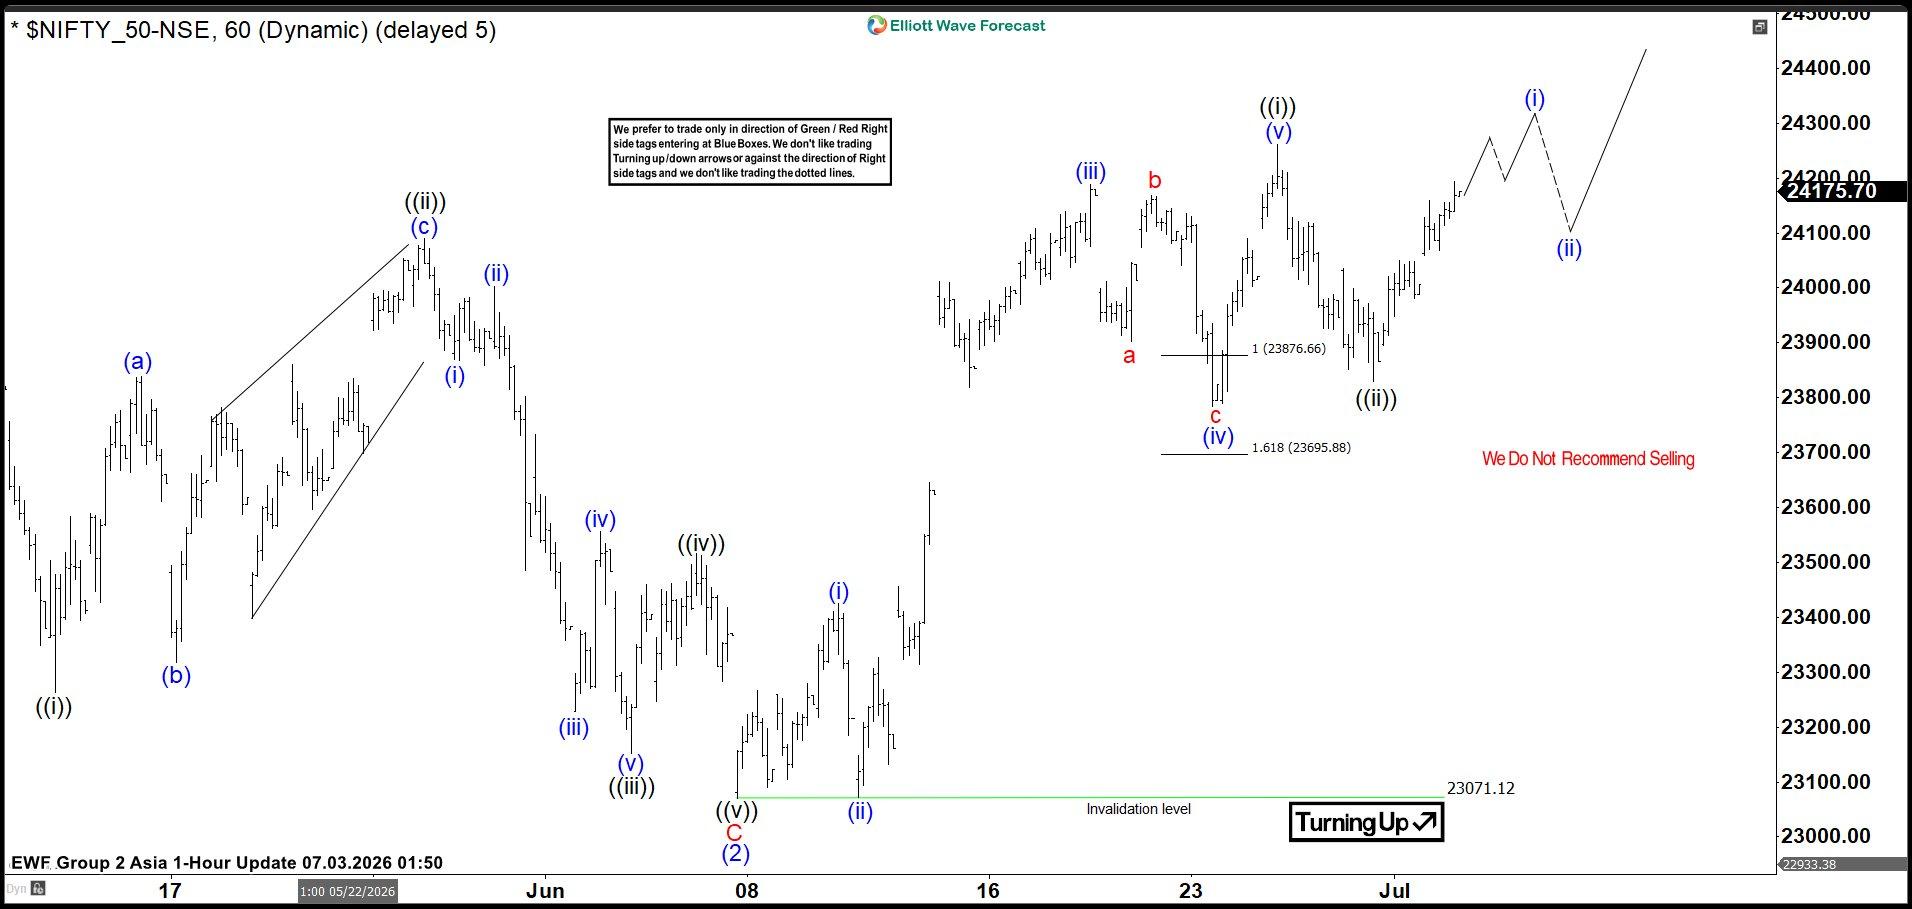
NIFTY Elliott Wave 1 Hour Chart 06.23.2026
NIFTY index has found buyers at the Equal Legs zone, just as expected. We saw a decent reaction from that area, and price rallied toward new highs as anticipated. As a result, long positions taken from the Equal Legs zone are now risk-free. We expect the index to continue finding buyers in a 3-7-11 swing structure, as long as the pivot low at 2307.12 holds.
Important note: Our analysis is not based on Elliott Wave in isolation. We perform detailed higher-time-frame cycle analysis, which shows an incomplete market structure. This is one of the key drivers of price action, along with correlation analysis and broader market context.
We also teach our members in live analysis sessions how to identify incomplete bullish and bearish sequences. Even a 14-day trial, is enough to noticeably improve your trading analysis and forecasting approach.
Penafian: Pandangan yang dinyatakan adalah semata-mata dari pengarang dan tidak mewakili kedudukan rasmi Followme. Followme tidak bertanggungjawab ke atas ketepatan, kesempurnaan, atau kebolehpercayaan maklumat yang diberikan dan tidak bertanggungjawab untuk sebarang tindakan yang diambil berdasarkan kandungan, melainkan dinyatakan secara bertulis secara jelas.
 Tiada ulasan lagi. Jadilah yang pertama berkongsi pandangan anda.