


SMC Trading point update
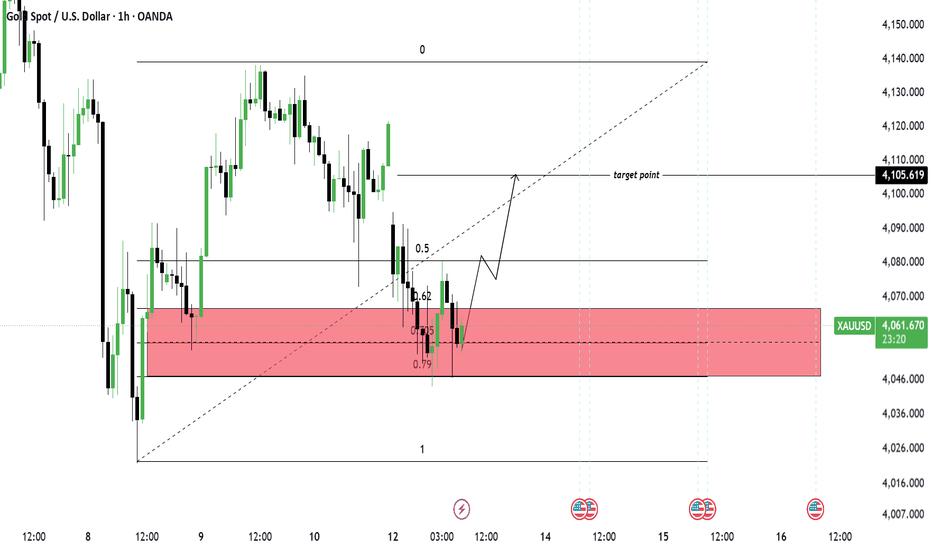
Chart Overview
• Pair: Gold Spot / USD - 1 Hour timeframe
• Current price: $4,062.43
• Date: Jul 13, 2026 07:25 UTC-5
• Bias on chart: Bullish pullback → continuation up
Key Levels Marked
1. Major Demand Zone - RED BOX: $4,046 - $4,066
Price just wicked into the 0.705 - 0.79 fib area inside this zone and bounced. This is strong confluence: fib + horizontal demand + diagonal trendline support.
2. Fib Retracement: Drawn from swing low to swing high
• 0.5: $4,080
• 0.62: $4,070
• 0.705 - 0.79: Inside the red demand box
• 0: $4,140
3. Target Point: $4,105.61
This lines up just under the previous 1H supply and the diagonal resistance.
Me SMC trading point
4. Diagonal Trendline: Rising support from the swing low. Price tapped it and reacted up.
The Idea on the Chart
The arrow shows the expected move:
1. Buy from demand: Reaction off $4,046 - $4,066 zone + trendline
2. First Target: $4,080 - 0.5 fib
3. Main Target: $4,105 - Previous 1H supply / "target point"
This is a classic SMC "buy in discount" setup. Price came to demand, took liquidity below, and is now pushing up.
dipcrschn Signal Format
• Bias: Bullish above $4,046
• Buy Zone: $4,050 - $4,065
• SL: Below $4,040 - under the zone + structure
• TP1: $4,080
• TP2: $4,105
• Invalidation: 1H close below $4,046 flips bias bearish
Please boost this analysis
Penafian: Pandangan yang dinyatakan adalah semata-mata dari pengarang dan tidak mewakili kedudukan rasmi Followme. Followme tidak bertanggungjawab ke atas ketepatan, kesempurnaan, atau kebolehpercayaan maklumat yang diberikan dan tidak bertanggungjawab untuk sebarang tindakan yang diambil berdasarkan kandungan, melainkan dinyatakan secara bertulis secara jelas.
 Tiada ulasan lagi. Jadilah yang pertama berkongsi pandangan anda.