


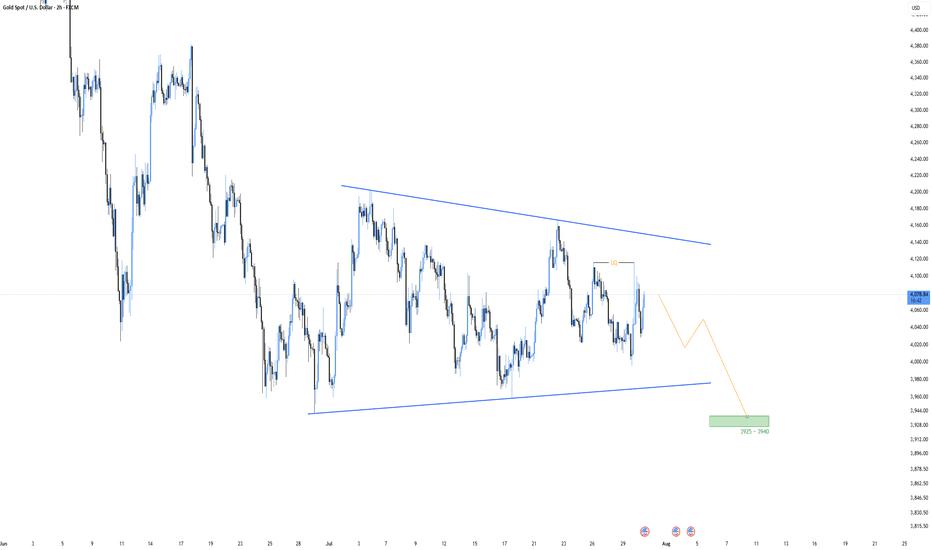
XAU/USD — SYMMETRICAL TRIANGLE COMPLETION | NEXT BEARISH IMPULSE TOWARD 3925–3940
Timeframe: 2H | Reference price: 4077 | Structure: Post-decline contracting correction
EXECUTIVE THESIS
XAU/USD remains inside a large symmetrical triangle formed after a significant bearish impulse.
The triangle is interpreted as a corrective contraction rather than a confirmed accumulation structure. Price has produced a sequence of lower highs beneath the descending resistance boundary while the rising lower boundary has temporarily contained successive selloffs.
My primary expectation is that this corrective triangle is approaching completion and that the market may transition into the next bearish impulsive phase.
The bearish thesis is not confirmed merely because price remains inside the triangle. Confirmation requires the loss of internal support, displacement below the rising boundary, and subsequent acceptance beneath the broken structure.
The main downside objective currently marked on the chart is the 3925–3940 support and liquidity zone.
The complete invalidation condition is a confirmed breakout and acceptance above the descending upper boundary of the triangle. Such a development would shift the structure from bearish continuation toward a potential bullish expansion.
1. MACRO CATALYST LAYER
The dominant macro regime is a combination of:
- Restrictive real-yield pressure.
- Federal Reserve policy uncertainty.
- Persistent inflation risk.
- Geopolitical risk originating from the Middle East.
The Federal Reserve maintained its policy rate at 3.50%–3.75%, but the decision included three dissenting votes in favor of a rate increase.
This division indicates that inflation risk remains material and that the market cannot confidently price an immediate transition toward monetary easing.
USD Channel
A stable-to-firmer U.S. dollar creates a negative translation effect for dollar-denominated gold.
As long as the dollar remains supported by relatively restrictive U.S. policy expectations, upside attempts in gold may remain corrective rather than impulsive.
A sharp dollar breakdown would weaken the bearish gold scenario and increase the probability of an upside triangle breakout.
Real-Yields Channel
The real-yield channel is currently the primary bearish macro force.
Higher nominal Treasury yields, combined with persistent inflation uncertainty, raise the opportunity cost of holding a non-yielding asset such as gold.
For the bearish continuation scenario to remain fundamentally aligned, Treasury yields should remain elevated or extend higher following U.S. inflation and growth data.
A sustained decline in real yields would challenge the bearish structure even before the upper triangle boundary is broken.
Risk-Sentiment Channel
Escalating geopolitical tension creates safe-haven demand for gold.
However, the current geopolitical shock is also lifting energy-price and inflation risks. That transmission can generate higher yields and a more restrictive Federal Reserve path, offsetting the direct safe-haven bid.
Therefore, the present market is not a conventional risk-off environment in which gold rises mechanically.
The more accurate classification is:
Inflationary geopolitical risk with restrictive-yield pressure.
Liquidity Channel
The Federal Reserve is maintaining ample reserves, but there is no broad liquidity expansion strong enough to override the effect of elevated yields.
Liquidity conditions are therefore neutral-to-restrictive for gold rather than decisively supportive.
Catalyst Classification
- Primary classification: Inflationary.
- Secondary classification: Policy-uncertain.
- Growth effect: Potentially growth-negative if elevated yields and energy prices persist.
- Structural driver: Elevated real yields and unresolved inflation risk.
- Short-term noise: Event-driven safe-haven buying that fails to produce structural acceptance above resistance.
2. SENTIMENT AND CROSS-ASSET FLOW
The recent market reaction shows a conflict between risk-off demand and yield-driven pressure.
- Equities have shown vulnerability as elevated long-term borrowing costs pressure valuations.
- The U.S. dollar remains supported by policy divergence and safe-haven demand.
- Treasury yields remain the more important transmission mechanism for gold.
- Geopolitical demand is preventing a cleaner bearish repricing but has not produced a confirmed bullish breakout.
Gold is currently failing to fully benefit from geopolitical stress.
This divergence suggests that higher yields and inflation-driven policy expectations are dominating the traditional safe-haven relationship.
The current movement is therefore better classified as:
- Primary: Real-yield repricing.
- Secondary: Positioning adjustment inside consolidation.
- Not yet confirmed: Broad dollar-debasement trade.
- Not yet confirmed: Unconditional flight-to-safety demand.
3. TECHNICAL STRUCTURE
The broader chart shows a major decline followed by a contracting corrective structure.
The triangle consists of:
- A descending upper boundary connecting successive lower highs.
- An ascending lower boundary connecting the late-June and mid-July swing lows.
- Repeated internal rotations showing declining directional conviction.
- Price compression ahead of a potential volatility expansion.
This structure is consistent with post-impulse consolidation.
Because the triangle formed after a bearish leg, the contextual probability currently favors bearish continuation. However, symmetrical triangles are directionally neutral until one boundary is broken and accepted beyond.
Key Resistance Levels
- 4095–4115: Recent swing-high cluster and visible buy-side liquidity.
- 4140–4160: Descending triangle boundary and primary structural invalidation region.
- Above 4160: Potential transition toward a bullish expansion regime.
Key Support Levels
- 4020–4005: Immediate internal support and recent local-low cluster.
- 3970–3985: Rising triangle boundary near the current time axis.
- 3925–3940: Primary projected support and downside objective.
4. LIQUIDITY AND ORDER-FLOW CONTEXT
The recent highs around 4095–4115 contain visible buy-side liquidity.
A temporary move into this region would not automatically invalidate the bearish scenario. It could represent a liquidity sweep before bearish displacement.
The critical distinction is the behavior following any sweep:
- Sweep followed by immediate rejection: Supports bearish continuation.
- Break above 4115 without acceptance: Potential liquidity grab only.
- Sustained acceptance above 4115: Weakens the immediate bearish thesis.
- Displacement and acceptance above the upper trendline: Invalidates the bearish triangle interpretation.
On the downside, the 4020–4005 area represents the first meaningful sell-side liquidity pool.
A sharp break through this region would indicate long liquidation and potentially fresh bearish positioning.
The quality of the move is important:
- Sharp, wide-range bearish candles: Displacement and probable institutional repricing.
- Slow decline with overlapping candles: Grind without sufficient confirmation.
- Break followed by continuation beneath support: Acceptance.
- Break followed by immediate recovery above support: Rejection and failed breakdown.
5. POSITIONING AND STRUCTURAL BIAS
Narrative Bias
The symmetrical triangle is interpreted as the final corrective phase following the previous bearish impulse.
The preferred narrative is that price is preparing to begin another downside expansion toward 3925–3940.
Structural Confirmation
The narrative becomes structurally confirmed only after:
- Price loses the 4020–4005 internal support region.
- The rising triangle boundary is broken with clear bearish displacement.
- A retest of the broken structure fails.
- Price establishes acceptance beneath approximately 3970–3985.
Intraday Bias
Neutral-to-bearish while price remains below 4095–4115.
The intraday bearish bias strengthens below 4020 and becomes confirmed below the rising triangle boundary.
Intraday Invalidation
Sustained acceptance above 4115 would invalidate the immediate short setup and expose the upper triangle boundary.
Medium-Term Bias
Bearish continuation while price remains beneath the descending triangle resistance at approximately 4140–4160.
Medium-Term Invalidation
A confirmed 2H close above the descending boundary, followed by successful support acceptance above the breakout level, would invalidate the medium-term bearish thesis.
A wick above the boundary without follow-through would not be sufficient.
6. CONTINUATION SCENARIO — PRIMARY
Required Conditions
- Price fails to establish acceptance above 4095–4115.
- A rejection or liquidity sweep forms near the recent highs.
- The 4020–4005 support cluster is broken.
- Bearish displacement reaches and closes below the rising triangle boundary.
Trigger
A decisive 2H breakdown below the rising triangle boundary with an expanded candle body and limited lower-wick rejection.
Confirmation
A failed retest of the broken boundary or the 3970–3985 region as resistance.
The strongest confirmation would be a lower-timeframe bearish market-structure shift during the retest.
Execution Framework
- Aggressive entry: Bearish rejection from 4095–4115 after a liquidity sweep.
- Conservative entry: Breakdown and failed retest of 4020–4005.
- Highest-confirmation entry: Breakdown and retest of the rising triangle boundary.
Downside Objectives
- 4020–4005: Initial liquidity objective.
- 3970–3985: Triangle boundary and confirmation level.
- 3925–3940: Primary projected target and support zone.
The 3925–3940 zone is currently treated as the first major destination rather than a guaranteed final bottom.
Price behavior must be reassessed at this zone before projecting lower targets.
Continuation Invalidation
- Sustained acceptance above 4115 invalidates the immediate bearish entry model.
- A confirmed breakout above 4140–4160 invalidates the complete bearish continuation scenario.
7. REVERSAL SCENARIO — ALTERNATIVE
The bullish scenario becomes relevant if the market refuses to break the rising triangle support and instead removes the upper structural boundary.
Required Structural Failure
- The 4020–4005 support area continues to hold.
- Any downside liquidity sweep is rapidly reclaimed.
- Price breaks through 4095–4115 with bullish displacement.
- The descending triangle boundary is breached.
Bullish Trigger
A decisive 2H close above approximately 4140–4160.
Bullish Confirmation
A successful retest of the broken descending boundary as support, followed by a higher low and renewed bullish displacement.
Bullish Invalidation
A breakout above the triangle followed by an immediate close back below the upper boundary would indicate a failed breakout.
Loss of the reclaimed 4095–4115 area after the breakout would further weaken the bullish scenario.
8. EVENT-RISK FRAMEWORK
The most important near-term economic catalysts are U.S. PCE inflation, Core PCE, GDP and labor-market data.
Hot Inflation / Strong Growth Outcome
- Likely reaction: Higher Treasury yields.
- Likely USD reaction: Firmer dollar.
- Likely gold reaction: Bearish, particularly if 4020–4005 breaks.
- Technical implication: Increased probability of downside triangle resolution.
Soft Inflation / Weak Growth Outcome
- Likely reaction: Lower yields and reduced tightening expectations.
- Likely USD reaction: Weaker dollar.
- Likely gold reaction: Supportive.
- Technical implication: Increased probability of a move through 4115 and a test of the upper triangle boundary.
Geopolitical Escalation
The reaction depends on whether the safe-haven channel or the inflation channel dominates.
- Gold higher while yields fall: Genuine risk-off demand.
- Gold lower while oil and yields rise: Inflationary tightening shock.
- Gold and USD rising together: Defensive safe-haven positioning.
- Gold failing while USD rises: Dollar and real-yield dominance.
9. STRATEGIC DECISION
Market Classification: Bearish continuation setup inside unresolved symmetrical consolidation.
Primary Driver: Elevated real yields and persistent inflation-related policy uncertainty.
Secondary Driver: U.S. dollar resilience and the market's inability to establish acceptance above recent buy-side liquidity.
Counterforce: Geopolitical safe-haven demand.
Current Tactical Stance:
Maintain a conditional bearish bias while price remains below 4095–4115, but avoid treating the projection as confirmed before support is broken.
The preferred trade is not an unconfirmed short in the middle of the triangle.
The preferred execution is either:
- A confirmed rejection after a sweep of 4095–4115.
- A breakdown and failed retest of 4020–4005.
- A confirmed break and retest beneath the rising triangle boundary.
The main projected destination is 3925–3940.
A confirmed breakout and acceptance above 4140–4160 would invalidate the entire bearish structure and shift the strategic bias toward bullish continuation.
FINAL VIEW
The triangle appears mature enough for a volatility expansion, and the preceding bearish impulse gives the downside scenario contextual priority.
However, the setup remains a forecast until price removes support with displacement and establishes acceptance below the lower boundary.
Below the rising boundary: bearish impulse confirmation.
Above the descending boundary: bearish thesis invalidation and bullish regime transition.
This analysis presents a conditional market framework and is not financial advice. Position size and risk should be adjusted for elevated volatility surrounding major U.S. economic releases.
Penafian: Pandangan yang dinyatakan adalah semata-mata dari pengarang dan tidak mewakili kedudukan rasmi Followme. Followme tidak bertanggungjawab ke atas ketepatan, kesempurnaan, atau kebolehpercayaan maklumat yang diberikan dan tidak bertanggungjawab untuk sebarang tindakan yang diambil berdasarkan kandungan, melainkan dinyatakan secara bertulis secara jelas.
 Tiada ulasan lagi. Jadilah yang pertama berkongsi pandangan anda.