


⚖️ MACRO BACKDROP
Gold ends the trading week under significant bearish pressure as persistent US inflation and hawkish Federal Reserve expectations continue to weigh on the precious metal.
October US Producer Price Index increased 0.3% month-on-month, below the 0.4% forecast. However, annual producer inflation accelerated to 6.5%, highlighting persistent underlying price pressure.
The softer monthly reading initially triggered a recovery in gold, but the rebound failed to sustain momentum as elevated Treasury yields and expectations of additional Fed tightening remained dominant.
The Federal Reserve continues to maintain its 3.75%–4.00% policy range, while markets anticipate further tightening in December.
Longer-term central-bank gold accumulation and US fiscal uncertainty remain potential structural support factors, but neither has prevented the recent bearish repricing.
From an institutional perspective, the key question is whether the liquidity reaction around 3,850 represents genuine accumulation or merely a temporary pause before another bearish expansion.
📉 TECHNICAL ANALYSIS — H2
1. Market Structure — Bearish Continuation
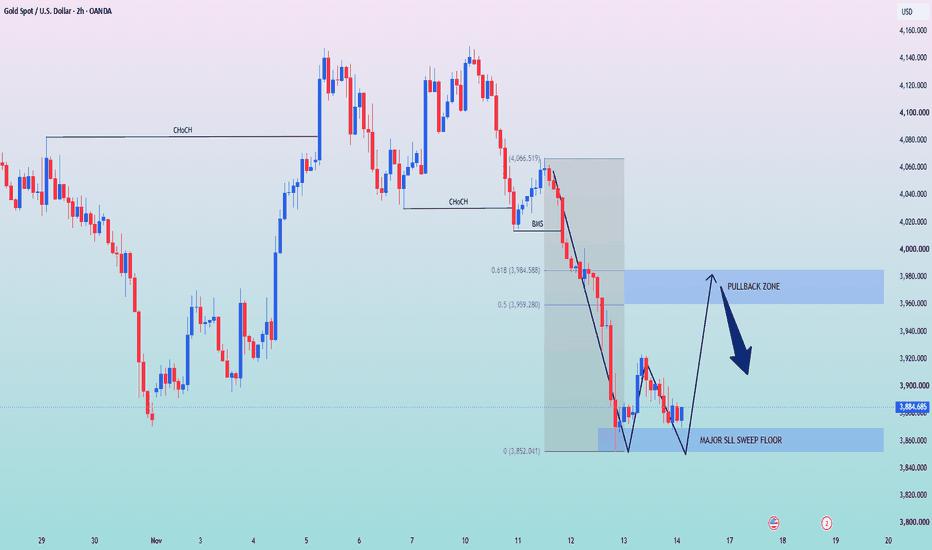
XAUUSD maintains a bearish H2 structure following its rejection from the 4,140 region.
The chart shows a bearish Change of Character (CHoCH), followed by a Break of Market Structure (BMS) and strong downside displacement.
Price subsequently declined from approximately 4,066 toward the 3,850 liquidity region.
The latest price action shows an initial recovery toward 3,920, followed by renewed weakness and another reaction near the lower demand area.
This suggests that selling pressure remains dominant, although the market may be attempting to establish a short-term liquidity base.
The formation is not yet a confirmed bullish reversal.
2. Major Sell-Side Liquidity — 3,850–3,870
The highlighted 3,850–3,870 area represents the major lower liquidity floor.
The Fibonacci zero reference is located at 3,852.041.
Recent price action has repeatedly reacted near this region, suggesting that sellers are encountering support.
A liquidity sweep followed by bullish displacement and a confirmed lower-timeframe CHoCH could support a corrective recovery.
However, sustained H2 acceptance below 3,852.041 would weaken the stabilization thesis and expose the market to further downside risk.
3. Fibonacci 0.500 — 3,959.280
The first major corrective objective is the Fibonacci 0.500 retracement at 3,959.280.
This level marks the lower boundary of the highlighted Pullback Zone.
A recovery into this area would represent a substantial retracement of the recent bearish displacement.
However, bullish momentum toward the midpoint would not automatically establish a new uptrend.
The reaction around this level will help determine whether sellers continue to control the broader H2 structure.
4. Fibonacci 0.618 — 3,984.588
The upper boundary of the Pullback Zone aligns closely with the 0.618 Fibonacci level at 3,984.588.
Together, the 3,959–3,985 region represents the main corrective resistance area.
A rally into this zone could attract renewed selling if buyers fail to establish higher-timeframe acceptance.
A bearish M15/M30 CHoCH, followed by downside displacement and a failed retest, would strengthen the continuation scenario.
Sustained H2 acceptance above 3,984.588 would weaken the immediate Fibonacci rejection thesis.
5. Structural Reference — 4,066.519
The Fibonacci upper reference is marked at 4,066.519.
This level corresponds to the starting area of the latest major bearish displacement.
A sustained recovery above this reference would challenge the prevailing bearish leg more significantly than a temporary breakout above the Fibonacci Pullback Zone.
6. Projected Price Delivery
Leg 1: Bearish displacement from the 4,066 region toward 3,852.
Leg 2: Initial bullish reaction around the Major SSL Sweep Floor.
Leg 3: Potential secondary liquidity test and formation of a short-term support base.
Leg 4: Conditional bullish relief rally toward the 3,959–3,985 Fibonacci Pullback Zone.
Leg 5: Potential bearish rejection and corrective decline toward 3,920, with the lower liquidity floor remaining relevant if selling accelerates.
The projected movements are conditional and require structural confirmation.
🔄 IF–THEN PLAYBOOK
PRIMARY SCENARIO — LIQUIDITY SWEEP & RELIEF RALLY
IF gold continues to defend the 3,850–3,870 region and forms a confirmed bullish M15/M30 CHoCH,
THEN a corrective recovery becomes technically plausible.
Confirmation Requirements:
- Sell-side liquidity is tested or swept without sustained downside acceptance.
- Bullish displacement breaks the nearest lower-timeframe swing high.
- Price successfully retests the reclaimed structure.
- Buyers sustain momentum beyond the initial recovery around 3,920.
Corrective Objectives:
Target 1: 3,959.280 — Fibonacci 0.500
Target 2: 3,984.588 — Fibonacci 0.618 / Pullback Zone Ceiling
SECONDARY SCENARIO — BEARISH REJECTION
IF price reaches 3,959–3,985 and confirms a bearish CHoCH/MSS with displacement,
THEN another downward rotation becomes possible.
Initial Downside Reference: Approximately 3,920.
Further Downside Objective: 3,850–3,870, conditional on renewed structural weakness.
The support floor must be reassessed if price revisits it.
ALTERNATIVE — DIRECT BEARISH BREAKDOWN
IF H2 price closes decisively below 3,852.041 and fails to reclaim the broken support,
THEN the liquidity-base hypothesis is invalidated.
The market would require a fresh downside structure assessment rather than assuming that the corrective rally remains valid.
INVALIDATION
Immediate bullish relief setup:
Sustained H2 breakdown below 3,852.041.
Immediate bearish Fibonacci rejection:
Sustained H2 acceptance above 3,984.588.
Broader bearish structural risk:
Sustained recovery above 4,066.519.
Will gold establish a liquidity base around 3,850 and recover toward the 3,985 Fibonacci zone, or will sellers regain control before the relief rally develops?
Penafian: Pandangan yang dinyatakan adalah semata-mata dari pengarang dan tidak mewakili kedudukan rasmi Followme. Followme tidak bertanggungjawab ke atas ketepatan, kesempurnaan, atau kebolehpercayaan maklumat yang diberikan dan tidak bertanggungjawab untuk sebarang tindakan yang diambil berdasarkan kandungan, melainkan dinyatakan secara bertulis secara jelas.
 Tiada ulasan lagi. Jadilah yang pertama berkongsi pandangan anda.
