
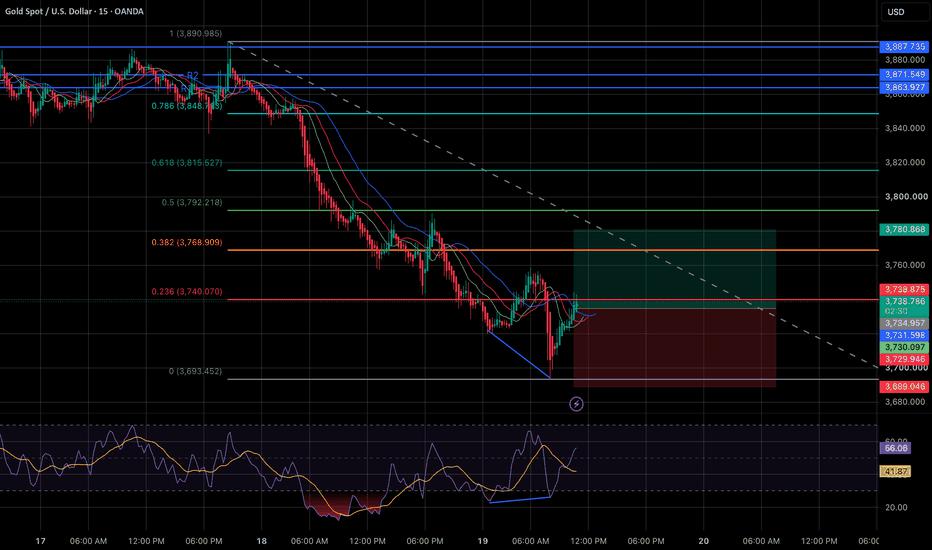
XAUUSD | Bullish Intraday Reversal Setup – Alligator & CWT Confirmation
AlphaEdge_Trading | 15M & 30M Timeframe Analysis
TECHNICAL OUTLOOK
Gold has experienced a significant bearish move from the 3,890 area toward the recent low around 3,693. However, the latest price action is showing signs of a potential short-term bullish reversal.
We are observing bullish developments across multiple timeframes. The 30M chart is showing bullish RSI divergence, while the Alligator indicator on the 5M timeframe has opened its mouth upward, suggesting that bullish momentum is developing.
Additionally, the CWT indicator is also providing a long setup, supporting the possibility of an intraday recovery.
Based on these signals, we are looking for a long opportunity around the current market price.
1. 30M TIMEFRAME: BULLISH DIVERGENCE
The 30M chart shows a strong preceding downtrend, with price consistently moving lower.
However, near the recent low around 3,693, the RSI developed bullish divergence. While price tested the lower area, RSI formed a higher low, indicating that bearish momentum may be weakening.
The latest RSI readings are:
- RSI: 47.17
- RSI Moving Average: 42.00
This recovery in momentum supports the possibility of a short-term bullish reversal. However, the broader 30M moving-average structure remains bearish, so further confirmation is required before considering a larger trend reversal.
2. 15M TIMEFRAME: FIBONACCI RETRACEMENT
On the 15M chart, Gold has recovered from the recent low of 3,693.452 and is now testing the Fibonacci 0.236 retracement level at 3,740.070.
The important Fibonacci levels are:
- 0.236: 3,740.070
- 0.382: 3,768.909
- 0.500: 3,792.218
- 0.618: 3,815.527
- 0.786: 3,848.713
- Previous swing high: 3,890.985
The current price is trading around 3,740, attempting to sustain its recovery above the 0.236 Fibonacci level.
A continuation of this recovery could bring the price toward the 0.382 retracement area, with our planned target at 3,780.
3. 5M ALLIGATOR & CWT CONFIRMATION
The Alligator indicator on the 5M timeframe is showing an upward-opening mouth, suggesting that bullish momentum is developing.
The CWT indicator is also providing a long signal.
These lower-timeframe signals, combined with the bullish divergence on the 30M chart and the Fibonacci recovery on the 15M chart, provide multiple technical reasons for considering an intraday long position.
The important point is that this is currently a short-term bullish setup against the preceding broader bearish move. We need to monitor whether buyers can sustain the recovery.
TRADE PLAN
- Direction: LONG
- Entry (EP): 3,736 (CMP)
- Stop-Loss (SL): 3,689
- Target (TP): 3,780
BULLISH SCENARIO
If Gold maintains its recovery and bullish momentum continues, the next important resistance area is around the 0.382 Fibonacci level at 3,768.909.
A sustained move through this area could support further upside toward our target of 3,780.
The bullish divergence on the 30M chart and the upward-opening Alligator on the 5M chart are the primary signals supporting this trade.
INVALIDATION & RISK MANAGEMENT
A breakdown toward the defined stop-loss at 3,689 would invalidate the planned long setup.
The broader 30M trend has not yet fully reversed, so this trade should be managed as an intraday recovery opportunity rather than an established long-term bullish trend.
Follow the defined stop-loss and avoid increasing exposure if the bullish signals weaken.
FINAL OUTLOOK
Gold is showing a potential intraday bullish reversal supported by 30M RSI divergence, 5M Alligator confirmation, CWT long signal, and a recovery around the 15M Fibonacci 0.236 level.
We are looking for a long entry at 3,736, with a strict stop-loss at 3,689 and a target of 3,780.
AlphaEdge_Trading | Multiple timeframe confirmation. Disciplined execution. Strict risk management.
Disclaimer: This is a technical intraday trading scenario based on the supplied charts and indicator signals. It is not a guarantee of price movement or personalized financial advice.
Penafian: Pandangan yang dinyatakan adalah semata-mata dari pengarang dan tidak mewakili kedudukan rasmi Followme. Followme tidak bertanggungjawab ke atas ketepatan, kesempurnaan, atau kebolehpercayaan maklumat yang diberikan dan tidak bertanggungjawab untuk sebarang tindakan yang diambil berdasarkan kandungan, melainkan dinyatakan secara bertulis secara jelas.
 Tiada ulasan lagi. Jadilah yang pertama berkongsi pandangan anda.